Viewing Quota History Logs
The Quota History log is similar to Current Quota except that the administrator cannot reset time windows for users here. The differentiating feature of Quota History is that the Status column reports how the user was reset: explicitly by the administrator or automatically after the 10-minute time window increment has passed.
To view a log on quota history:
- From the Home tab, select the Statistics tab, and from the drop-down, select Logs.

The Logs panel displays.

- Select the Quota History tab.

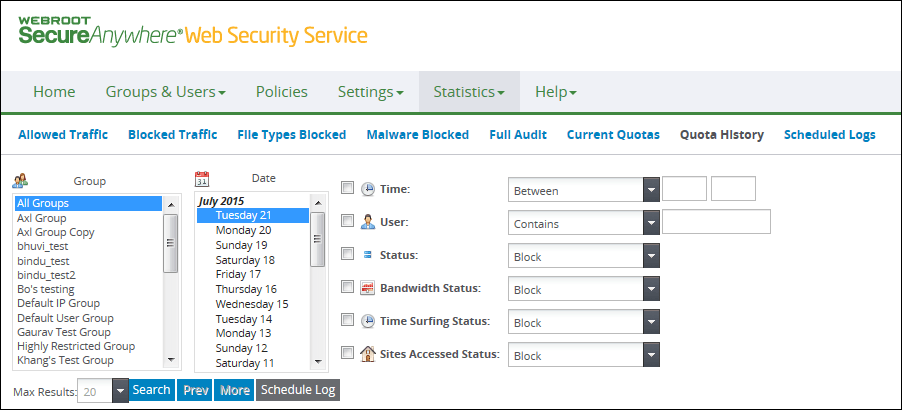
The Quota History page displays. By default, the view displays data based on all groups using the default filters. The cells are color-coded based on status.

- Specify the groups to include in the logs (deleted groups are displayed with the ** prefix). Select All Groups; or, to specify one or more groups:
- Click to select a single group.
- Press Shift-click or click and drag to select contiguous groups.
- Press Ctrl-click to select non-contiguous groups.
- Select one or more dates from the last 90-day period:
- Click to select a single date.
- Press Shift-click or click and drag to select contiguous dates.
- Press Ctrl-click to select non-contiguous dates.
- Optionally, set log filters based on the following table.
If you don't select filtering options, the log returns all records for the specified groups and dates.
| Filters |
Description |
| Time |
- Select the checkbox and specify a search option:
- Between returns logs on activity that occurred within the specified time range.
- Not between returns logs on activity that occurred outside (before and after) the specified time range.
- Enter the starting time in the first text box. For time, use the following 24-hour format: hh:mm where hh is from 00 to 23 and mm is from 00 to 59. Examples of valid time formats: 08:00 or 13:30.
- Enter the ending time in the second text box. This value must be at least one minute from the starting time. For example, if the starting time is 04:03, the ending time must be at least 04:04. If your starting and ending times are 04:04 to 04:04, no records are returned even if data exists for 04:04:22.
|
| User |
- Select the checkbox and specify a search option:
- Contains returns logs on users whose name contains the text string you provide.
- Does not contain excludes users whose name contains the text string you provide.
- Equals returns logs on the user whose name exactly matches the text string you provide.
- Does not equal returns logs on users whose names do not exactly match the text string you provide.
- Type a text string of up to 64 characters, the maximum length for user names, in the text box to be matched based on the criteria. Valid characters are a to z, A to Z, and 0 to 9.
|
| Status |
Refers to the user's overall status with regard to the quota:
- Block means the user is currently blocked from further web access.
- Quota Reached means the user has reached 85% of any quota limit.
- Alert means that a notification was sent to the administrator about blocked users.
- Normal means the user is still within the limits, or the user has been deactivated and is no longer being filtered for web activity.
- Reset means the user was previously blocked and then released by the administrator.
|
| Bandwidth Status, Time Surfing Status, Site Accessed Status |
- Select the checkbox to use this data point.
- Select one search criteria:
- Block returns users that are currently blocked.
- Quota Reached returns users that reached or, in some cases, exceeded their quota limits.
- Alert returns users that are at 85% of any quota type limit.
|
To change the number of returned records:
- Open the Max Results drop-down menu and select the number of records to display for the search.
Note that the Filter text box is disabled if you set the Max Results value to 200. To use the Filter box, select another Max Results value.
- Click Search.
Matching records are displayed in tabular format. The following table describes the data displayed.
| Quota History Data |
Description |
| Date |
The date you selected for the log. If you selected multiple dates, the log allocates one row per date. |
| Time |
The time the user requested access to a site. |
| Group |
The group to which the user belongs. |
| User |
The name of the user being tracked for usage. |
| Status |
Refers to the user's overall status with regard to the quota:
- Block means the user is currently blocked from further web access.
- Quota Reached means the user has reached 85% of any quota limit.
- Alert means that a notification was sent to the administrator about blocked users.
- Normal means the user is still within the limits, or the user has been deactivated and is no longer being filtered for web activity.
- Reset means the user was previously blocked and then released by the administrator.
|
| Bandwidth, Time Spent Surfing, Sites Accessed |
The bandwidth usage, time spent surfing the web, or sites accessed. The background color denotes the following:
- Red means the user is blocked.
- Yellow means usage is at 85% and the user has been alerted with the pop-up warning.
- Blue means the user has reached the quota limit.
- Green means normal; usage is still within the limits.
|
| Mail Sent |
The status of the notification sent to the administrator:
- Yes means the email has been sent.
- No means the option to send email notification to the administrator was not selected on the Quotas subtab, or an error was detected in the transmission, therefore the email was not sent.
- NA means the option is not enabled in the policy.
|


