Related Items:
WSS Getting Started User Guide
Webroot DWP Configuration Guide
Guide Sections:
About Reports
The Web Security Service provides charts that dynamically report on bandwidth trends and that show top allowed and blocked activity. You can also create configurable customer charts.
Report data is updated twice per hour.
Note: To access the Reports tab, you must have View permission for Manage Report/Dashboard.
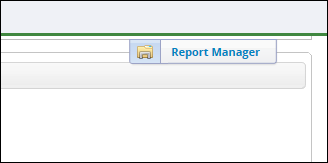
To manage reports, select from the Home tab, from the Statistics drop-down menu, select the Charts tab. Then, in the upper right corner, click the Report Manager button.

The default report view shows an adjustable timeline chart of bandwidth usage for the last 30 days and a tabular view of the bandwidth used by groups, users, and domains. The Report Manager contains charts and reports. It is closed when you first access the Reports tab.

You can schedule saved charts to be delivered on a regular basis and specify recipients for emailed PDF versions of reports.
Report Views
You can adjust the view of the charts in the Reports tab to show data in different ways.
| To view data for a point on a timeline chart: |
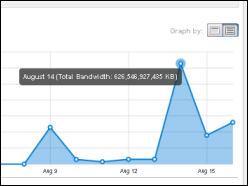
Hover your cursor over a point on a timeline to view data for the point. 
|
| To drill down into top groups, users, and domains by bandwidth: |
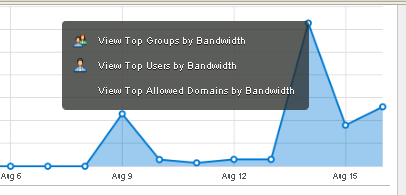
Click a point on a timeline and select a drill-down view to bandwidth usage. 
|
| To choose the time window to view: |
On the Reports tab, select the Graph by button to choose the type of time window to view. The button on the left changes the display to a weekly view, while the button on the right changes the display to a monthly view. 
|
| To adjust the time range to view on timeline charts: |
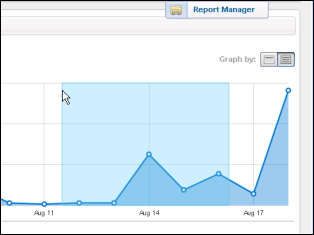
Click and drag your mouse cursor anywhere on the timeline chart to highlight a time window: 
When you release your mouse button, the timeline expands and you can drill down into the selected range. |
| To choose the chart format: |
You choose a chart format by selecting a Visualization button: 
|
Types of Reports
You can view and generate charts using the following types of canned preconfigured reports and saved custom reports:
Note: All Top N charts show the top 10 select criteria by default. Top Groups By Bandwidth shows the top 10 groups. The options for Top N charts are 10, 20, and 50.
The following table describes the available reports.
| CANNED CHARTS | DESCRIPTION |
| Bandwidth Usage |
Provides the following:
|
| Top Users by Bandwidth |
Provides the following:
|
| Top Users by Time Spent Surfing |
Provides the following:
|
| Top Users By Website Domains Visited |
Provides the following:
Note: Websites visited are not the same as page requests. Pages pertain only to text-type content. |
| Top Site Categories by Bandwidth | Top categories according to bandwidth. Note that one site might display multiple categories, some of which display streaming data. |
| Top Site Categories by Page Request |
Provides the following:
|
| Top Domains by Bandwidth | Top requested domains that are allowed by policy, according to bandwidth used. |
| Top Domains by Page Request | Top requested domains within a specified timeframe. |
| Top Blocked Site Categories |
Provides the following:
|
| Top Blocked Domains by Page Request |
Provides the following:
|
| Top Blocked Users |
Provides the following:
|
| Top Blocked Users by Malware Categories | Requires that Policies > Malware Protection > Full Threat Protection is enabled. If full protection is not enabled, the report has no data. |
| Top Blocked Malware Name |
Provides the following:
|
| All Malware Categories Blocked |
Provides the following:
|
| SAVED CHARTS | DESCRIPTION |
| Top Groups By Bandwidth |
Provides the following:
|
| Top Users by # of Text Web Page Requests |
Provides the following:
|
| Top Users by Bandwidth for One Category |
Provides the following:
|
| Top Users by Page Requests for One Category | Number of page requests for one site category. |
| Top Users by Bandwidth for One Domain | Top consumers of bandwidth for one domain. |
| Top Users by Number of Clicks for One Domain | Top consumers by number of page requests for one domain. |
| Top Blocked Users by Site Category | Top blocked users by site category. |
| Top Blocked Users by Malware Name | Top blocked users by malware name. |
| Daily Bandwidth Usage |
Provides the following:
|
| Daily Bandwidth by User |
Provides the following:
|
| Daily Website Domains Visited by User |
Provides the following:/p>
|
| Daily Time Spent Surfing by User |
Provides the following:
|
| Hourly Bandwidth by Group |
Provides the following:
|
| Hourly Text Web Page Requests |
Provides the following:
|
| Hourly Block Statistics |
Provides the following:
|
| Hosting Services | Customer Support | Additional Resources |
|
© 2017 Windstream Communications. All Rights Reserved. Privacy | Terms of Use | Hosting Policy | Legal Notices | Acceptable Use Policy | Digital Content License Agreement |

