Related Items:
WSS Getting Started User Guide
Webroot DWP Configuration Guide
Guide Sections:
Viewing Full Audit Logs
Full audit logs capture data on all traffic that passes through the Web Security Service. This is where you see a combination of all log types, such as allowed traffic, blocked traffic, blocked file types, and blocked malware, in one log. The information displayed by Full Audit requires that your account is enabled for Full logging. This is set up by your provider based on your provisioning terms.
Note: To view a full audit log, you must have Full Audit permission for Manage Log, and Audit Log permission for Manage Audit Logs.
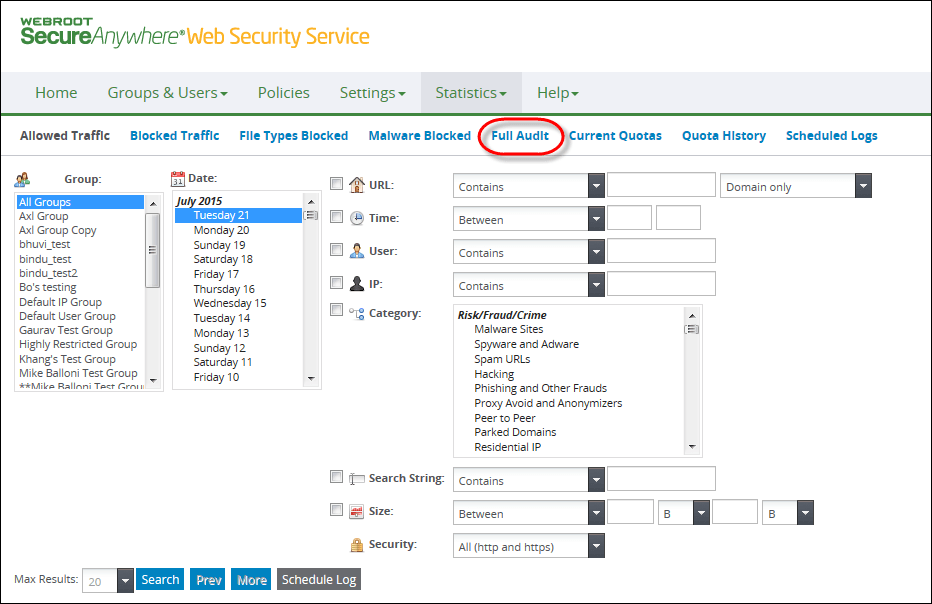
To view a full audit log:

The Logs panel displays.


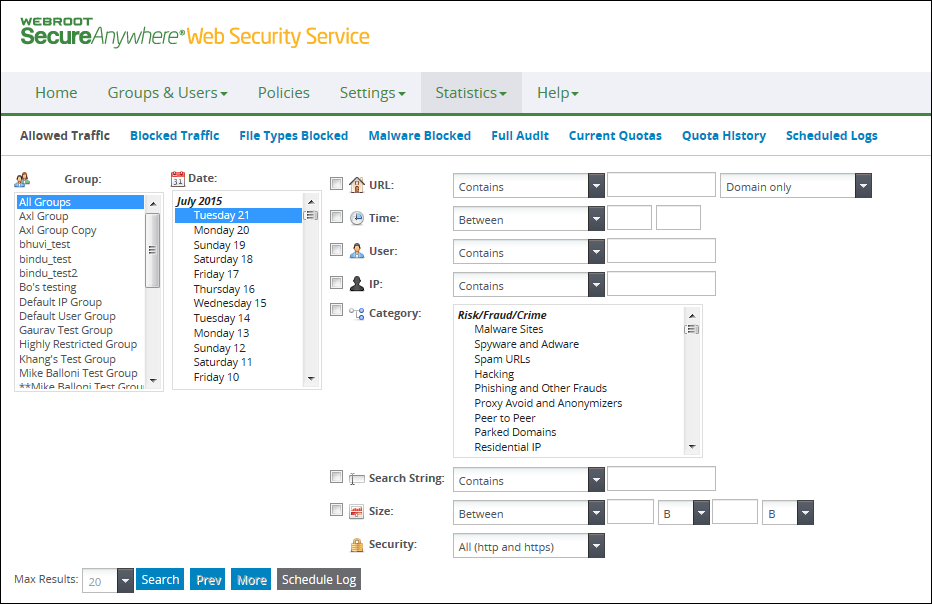
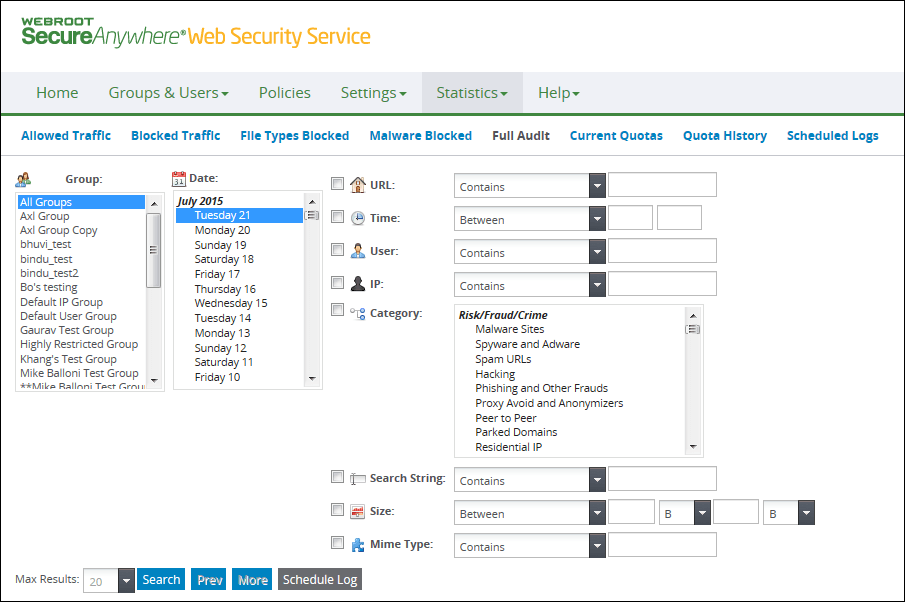
The Full Audit pane displays

| LOG SEARCH FILTERS | DESCRIPTION |
| URL |
Select the checkbox and specify a search option:
Type the string in the text box to be matched based on the criteria. Type a minimum of one character. Specify whether the search applies to domain only, or to the domain and full path. An example of a domain is: An example of a domain and path is: |
| Time |
Select the checkbox and specify a search option:
Enter the starting time in the first text box. For time, use the following 24-hour format: hh:mm where hh is from 00 to 23 and mm is from 00 to 59. Examples of valid time formats: 08:00 or 13:30. Enter the ending time in the second text box. This value must be at least one minute from the starting time. For example, if the starting time is 04:03, the ending time must be at least 04:04. If your starting and ending times are 04:04 to 04:04, no records are returned even if data exists for 04:04: |
| User |
Select the checkbox and specify a search option:
Type a text string of up to 64 characters, the maximum length for user names, in the text box to be matched based on the criteria. Valid characters are a to z, A to Z, and 0 to 9. |
| IP |
Select the checkbox and specify a search option:
Type a numeric string in the text box to be matched based on the criteria. Valid characters are 0 to 9 and the dot separator. |
| Category |
Select the checkbox and specify the category:
|
| Search String |
Select one search criteria:
Type a text string in the text box to be matched based on the criteria. |
To change the number of returned records:
| Full Audit Data | Description |
| Date | The date you selected for the log. If you selected multiple dates, the log allocates one row per date. |
| Time | The time the user requested access to a site. |
| Group Name | The group from which traffic was generated. |
| User Name | Displays the name of the user that accessed the site. |
| IP Address | Displays the IP address from which traffic was generated. |
| Category | The requested URL's categories as described in Category Descriptions under Filtering Websites by Category. Displays Uncategorized if the URL has no category. |
| URL | The URL address that the user has accessed. |
| Search Engine String | The query string typed by the user to make searches on the web. |
| File Type | Displays the file type that was downloaded or uploaded. Displays Unknown if the file type is not known. See Blocking File Types. |
| Mime Type | The content of the file that was downloaded or uploaded. For example, a file type of gif would have a content type of image. |
| Size | The file size in bytes. File sizes contribute to bandwidth usage. |
| Malware Name | The name of the malware (for example, storm.gen). |
| Malware Type | Displays the malware category. For example, malware called storm.gen would have the category or type Trojan Horse. |
| Malware Direction | Displays inbound for downloaded malware or outbound for uploaded malware. If outbound, use the IP address to identify the system that has the malware. |
| Hosting Services | Customer Support | Additional Resources |
|
© 2017 Windstream Communications. All Rights Reserved. Privacy | Terms of Use | Hosting Policy | Legal Notices | Acceptable Use Policy | Digital Content License Agreement |

