Related Items:
WSS Getting Started User Guide
Webroot DWP Configuration Guide
Guide Sections:
Managing Charts in the Dashboard
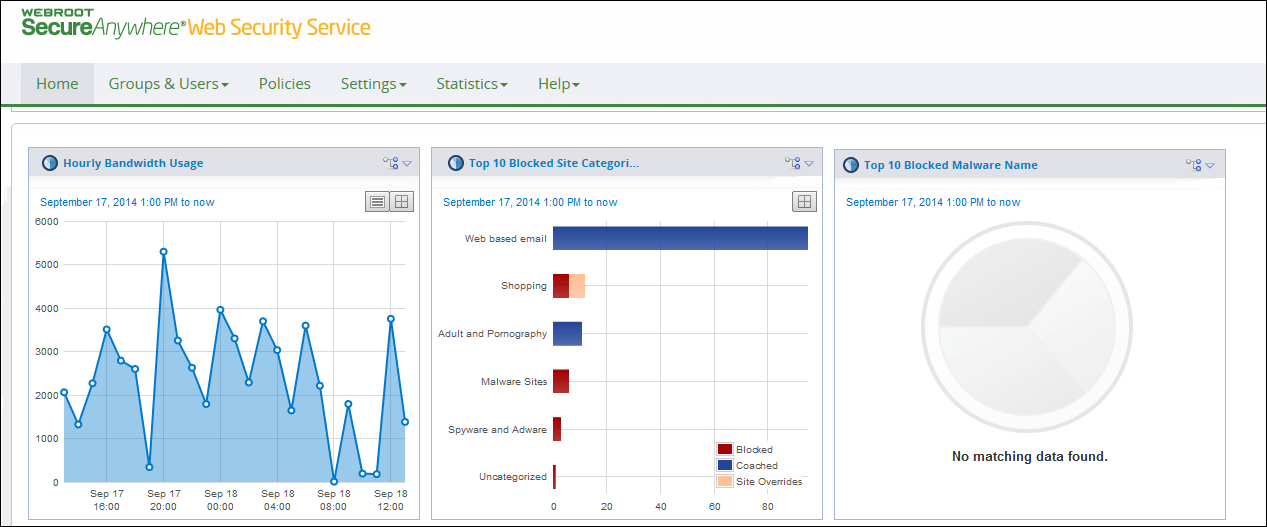
The Dashboard is the starting page of the Web Security Service, where you can choose up to six charts to view simultaneously. You can rearrange chart locations by dragging and dropping. You can also change chart attributes such as the title of the panel, report type, time window, or display type.
Note: You must have View permission for Manage Report/Dashboard to see the dashboard charts. If you do not have this permission, the dashboard shows only the Notifications panel.
When you log in to the Management Portal, the dashboard is the first screen you see:

The dashboard includes these six charts by default:
Dashboard data for most charts is updated every 15 to 30 minutes. The Hourly Time Spent Surfing and Hourly Website Domains Visited charts are updated once per hour. The minimum screen resolution recommended for viewing the dashboard is 1200 x 800. Smaller resolutions might not display complete dashboard panels. To refresh the dashboard data view of all charts click the Dashboard tab, or refresh the page (Shift-F5).
The dashboard charts show top-level summary information. For details about the charts and information about accessing more granular information, see Managing reports.
You view and manage charts using the icons at the top right of each chart panel.
To expand or collapse a chart panel, click the arrow icon: 
To modify a chart's attributes, click the edit icon: 
To see the table view of a chart, click the table view icon: 
To reset the chart view to the selected time window (timeline charts only), click the reset icon: 
| Hosting Services | Customer Support | Additional Resources |
|
© 2017 Windstream Communications. All Rights Reserved. Privacy | Terms of Use | Hosting Policy | Legal Notices | Acceptable Use Policy | Digital Content License Agreement |

